To interpret hyperspectral images and the products derived from them, remote sensing skills are required and often the software solutions available on the market are designed for expert users. To overcome this limitation in the exploitation of hyperspectral-based products, AVT-AS has created the MAPPIS visualization tool. MAPPIS enhances users’ visualization and interaction experience by providing simple built-in controls and analytics options. Users can easily explore complex datasets, fully understand the data and extract meaningful information. MAPPIS has three specific modules customized for agriculture, forestry and urban applications, but is easily expandable to other fields.
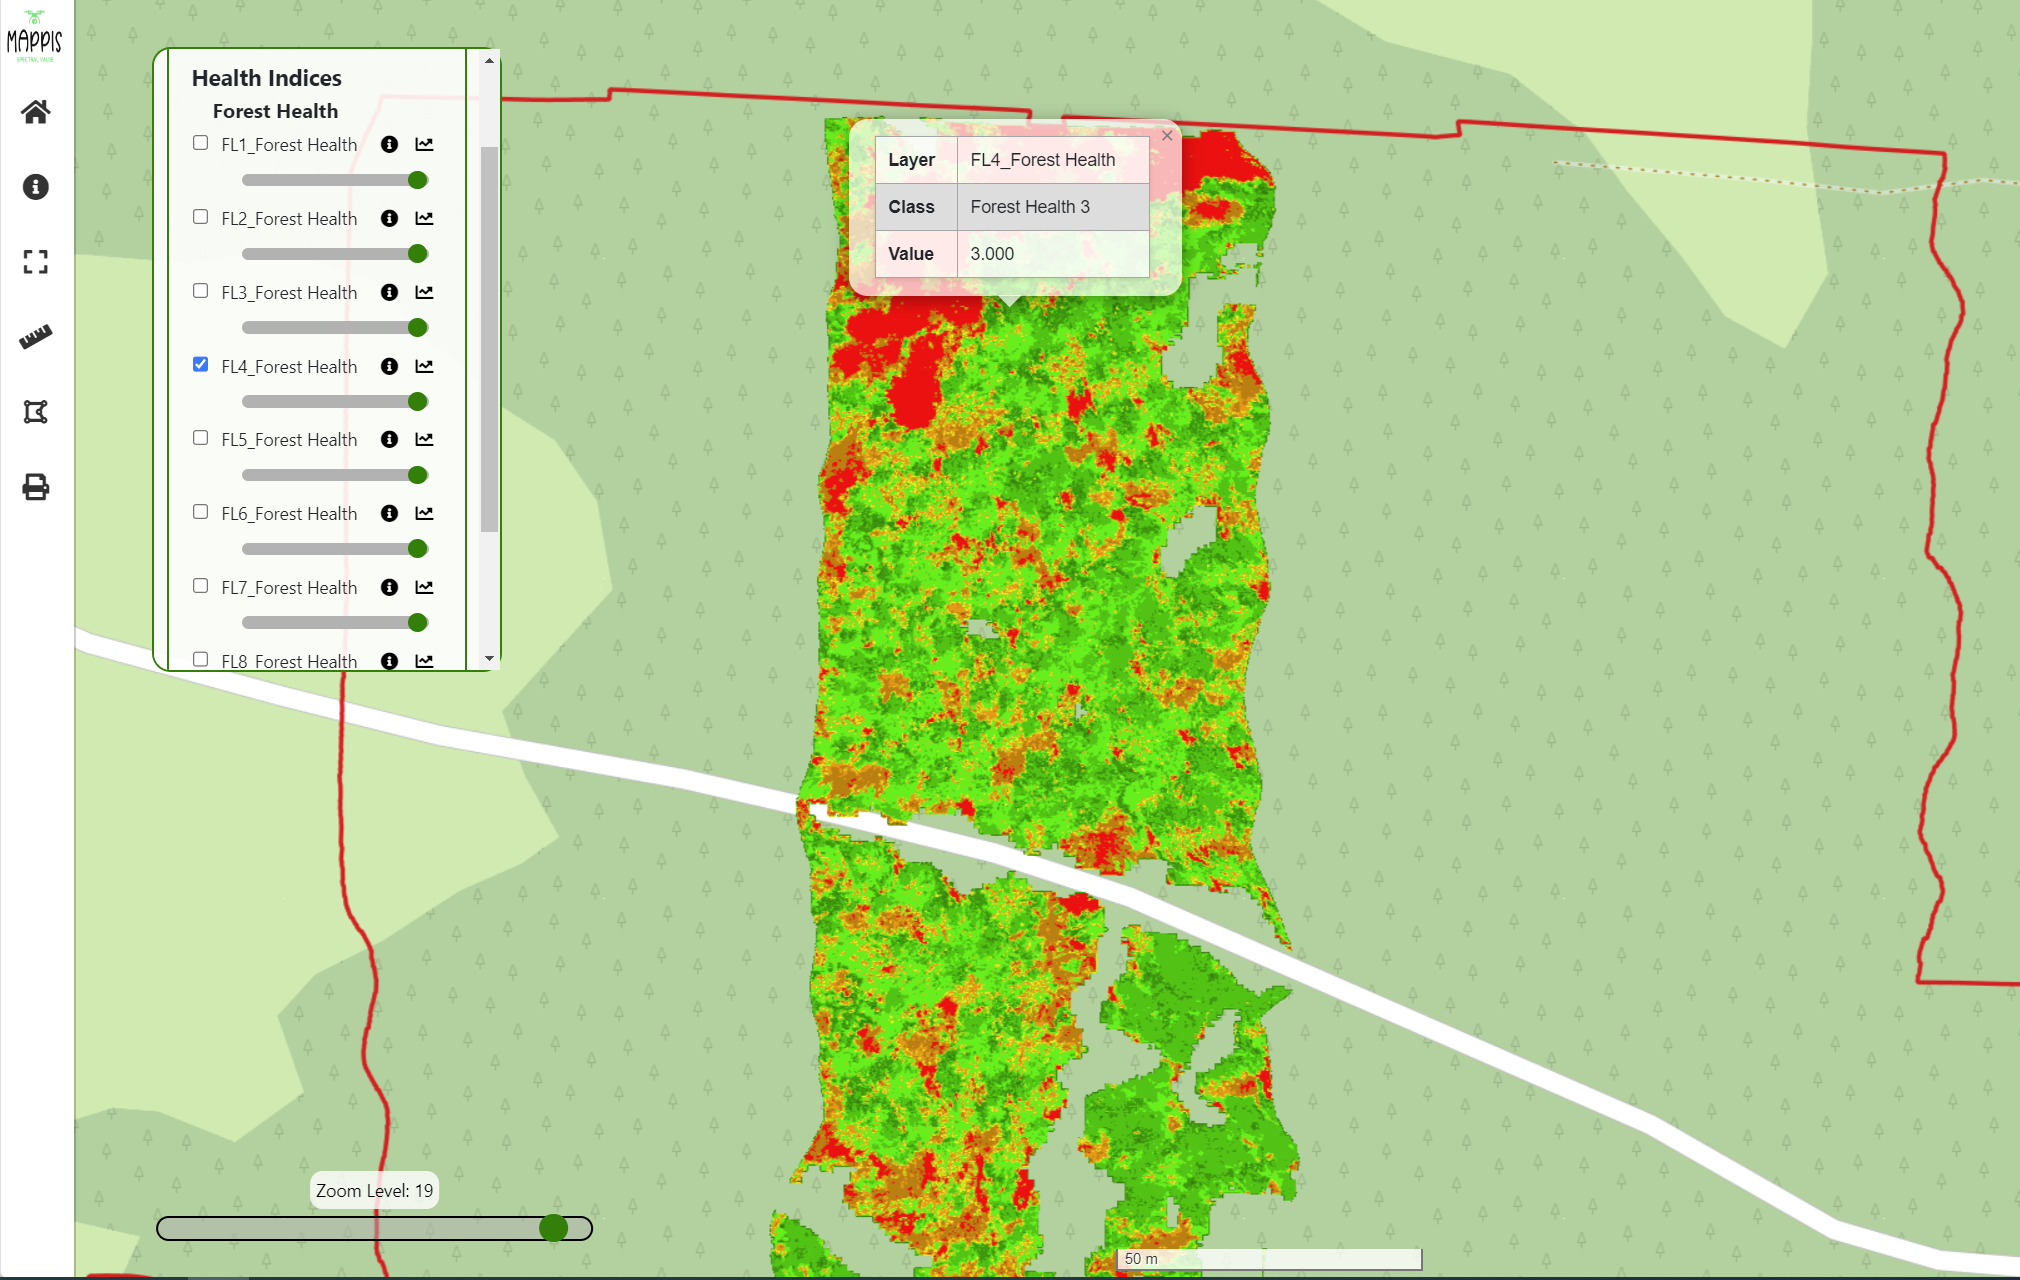
With MAPPIS it is possible to visualize combinations of hyperspectral bands, classification maps, spectral indices and other raster and vector products. Each layer is displayed with a variable degree of transparency to overlay and compare data of different nature. The user can measure distances and areas and represent the information in the form of statistics or graphs. MAPPIS can be used in the office or in the field, if installed on a tablet. The user in the field can annotate measurements and observations directly in the application during the survey and export the data in standard formats for future processing.
One of the major benefits of such a tool is that users do not need to process raw data. Instead, users can directly interact with the final products, such as pre-processed hyperspectral images with specific band combinations, spectral indices and classifications maps.
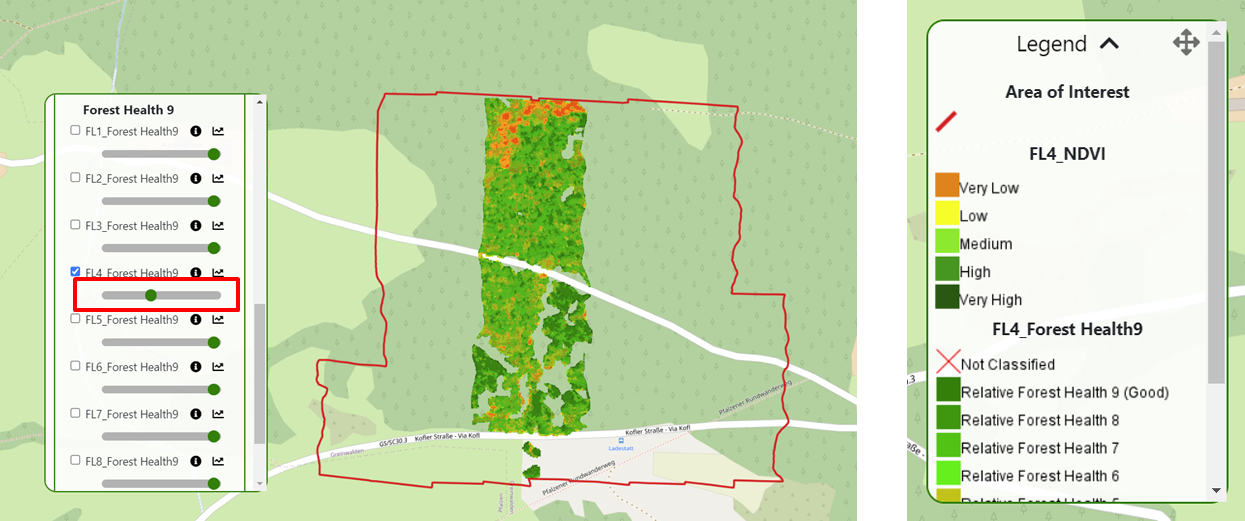
The use of colours and a clear legend allows users to quickly understand the data displayed
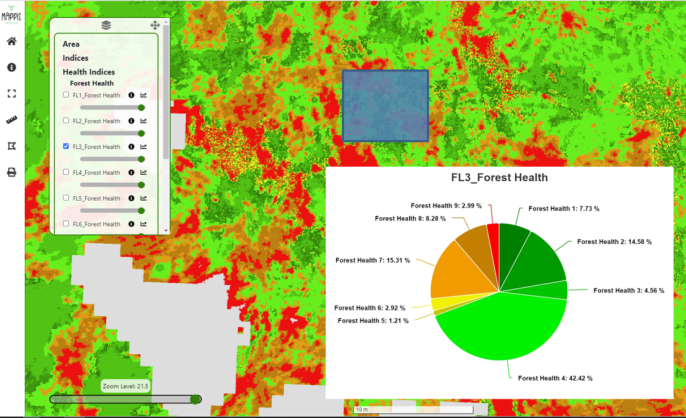
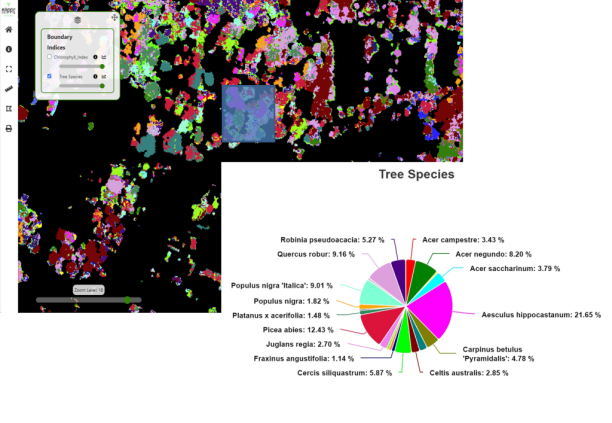
Users can draw a polygon in the project area and calculate statistics dynamically on that area, for example the health status (left) and the tree species (right)
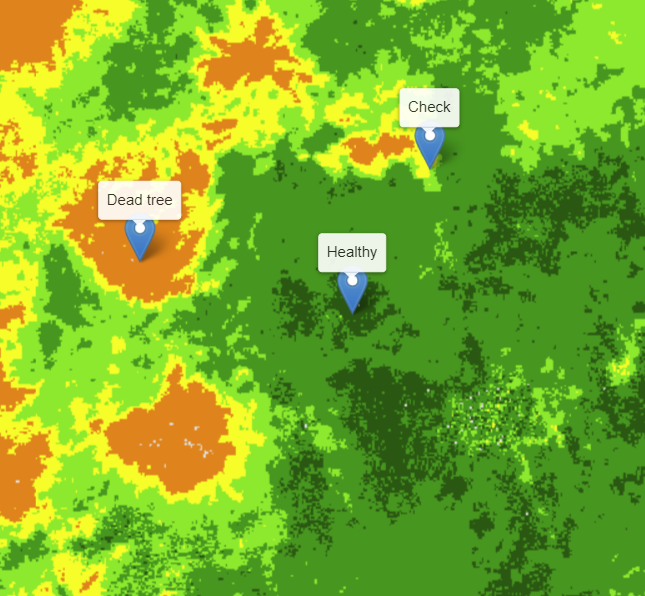
Users can annotate comments directly in the field on the tablet
Part of the activities is co-financed by law 6/99 of the Autonomous Province of Trento through the MAPPIS project.


